Blink and you miss it!
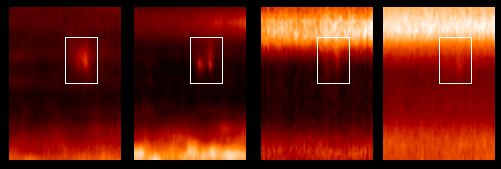
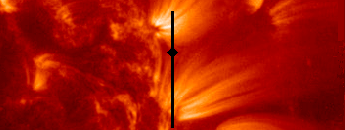
Caption: Recent observations by the Coronal Diagnostic Spectrometer (CDS) confirm the existence of what has been termed "active region blinkers" - small scale intensity events found in active regions, first reported by Walsh et al (ESA-SP 404,717,1997). These events appear to be the active region counterpart to the EUV blinkers which are observed in quiet sun regions (Harrison, Sol. Phys. 175, 467, 1997). EUV blinkers were noticed as enhancements by a factor of 2-3 in the flux of transition region lines. They last between 1 and 30 minutes, averaging at 13 minutes, and are estimated to have a typical length scale of 18 Mm.
These events, found in the latest run of SOHO Joint Observation Programme 83 (JOP083), have similar estimated time scales and length scales, but have higher energies. In addition, they are observed in higher temperature emission lines than EUV blinkers. It may be that these `active region blinkers' are an extension of the spectrum of EUV blinker activity into active regions.
There are relatively few examples of these events in all CDS data. It may be that these events are just as common as those seen by Harrison (1997) and it is the relative brightness of the active region that prevents them being seen. This would explain their relative rarity. Conversely, it may be that these events are simply not very common in active regions and CDS has been fortunate to see the events we have seen. Analysis of these dynamic phenomena is continuing.
Picture Credits: SOHO/CDS (ESA & NASA), TRACE (NASA)
Observations and data analysis by: Jack Ireland (ESA), Robert Walsh and Ineke De Moortel (University of St. Andrews)
Instrument/observatories: CDS (Coronal Diagnostic Spectrometer); TRACE;
Taken: 7 April 2000, 12:25UT - 12:55UT


