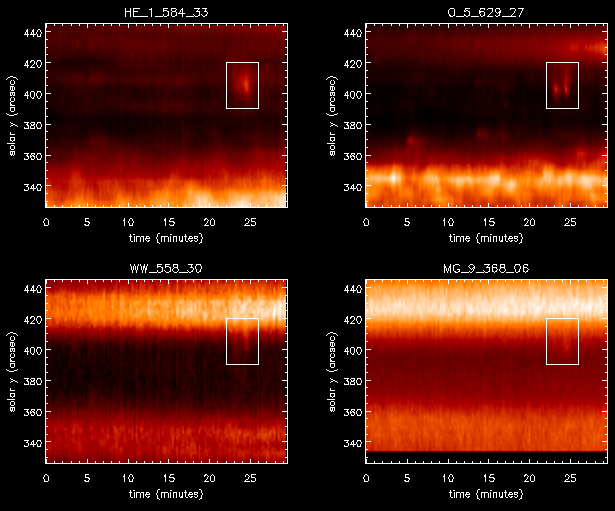

Coronal Diagnostic Spectrometer (CDS) time series images showing intensity as a function of time (left to right) and solar y-position (up/down). The active region blinker appears as a significant and isolated increase in intensity in all 4 emission lines and is highlighted by the enclosed box. Each emission line shows the solar atmosphere at a different temperature. The top right image, He I, is the coolest at 20,000 K. O V is around 200,000 K and Mg IX at around 1,000,000 K. The WW line denotes the summed emission of two lines, Ca X (500,000 K) and Ne VI (600,000 K).
Time is along the x axis, and position on the Sun (running from north at the top of each image to south at the bottom of each image) is along the y axis. The time series is formed by pointing the slit at a piece of the Sun and letting solar rotation move new pieces of active region into view. The images are then formed by stacking all the slices together to form a `map' of the evolution of a small portion of the active region
The target in this case was active region AR 8939; the images were formed on 7th April (beginning at 12:24 UT) from 120 north-south slices taken about 15 seconds apart.