
Double Whammy Fireworks
| Click on the images or links for larger versions | |
 1024x1024, MPEG:large, small, running difference. QuickTime: large, small. |
 1024x1024, MPEG:large, small, running difference. QuickTime: large, small. |
 1024x1024. |
 1024x1024, MPEG:full view, subfield, QuickTime: full view (small), subfield (small) |
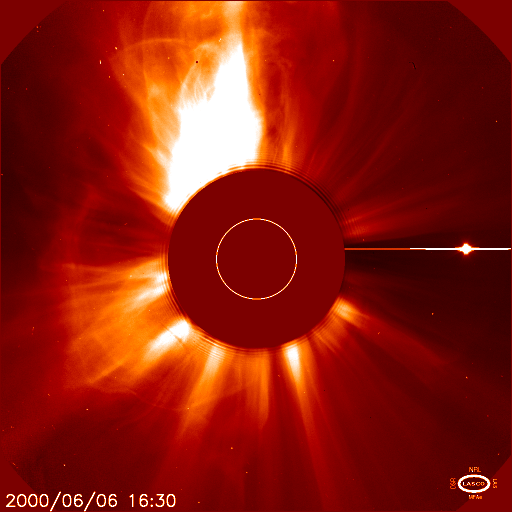
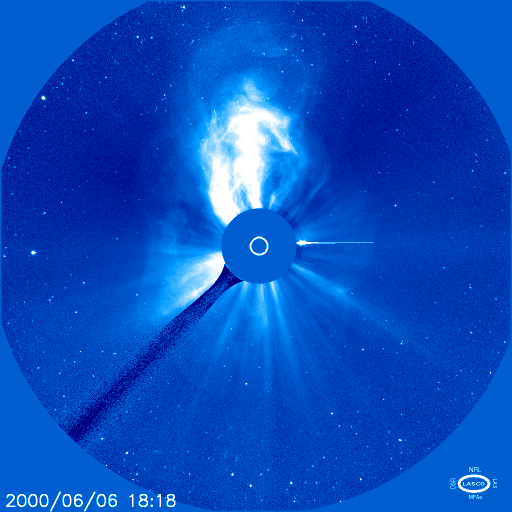
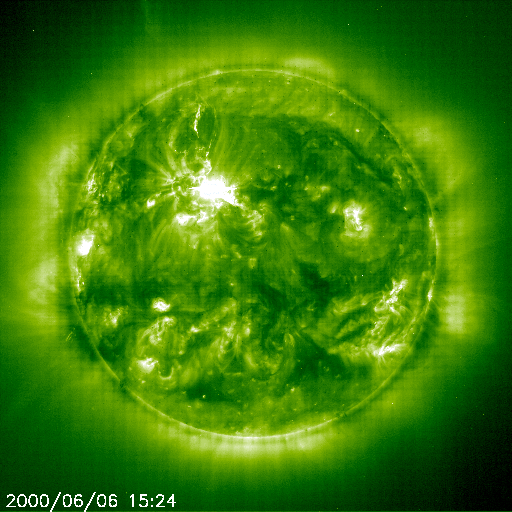
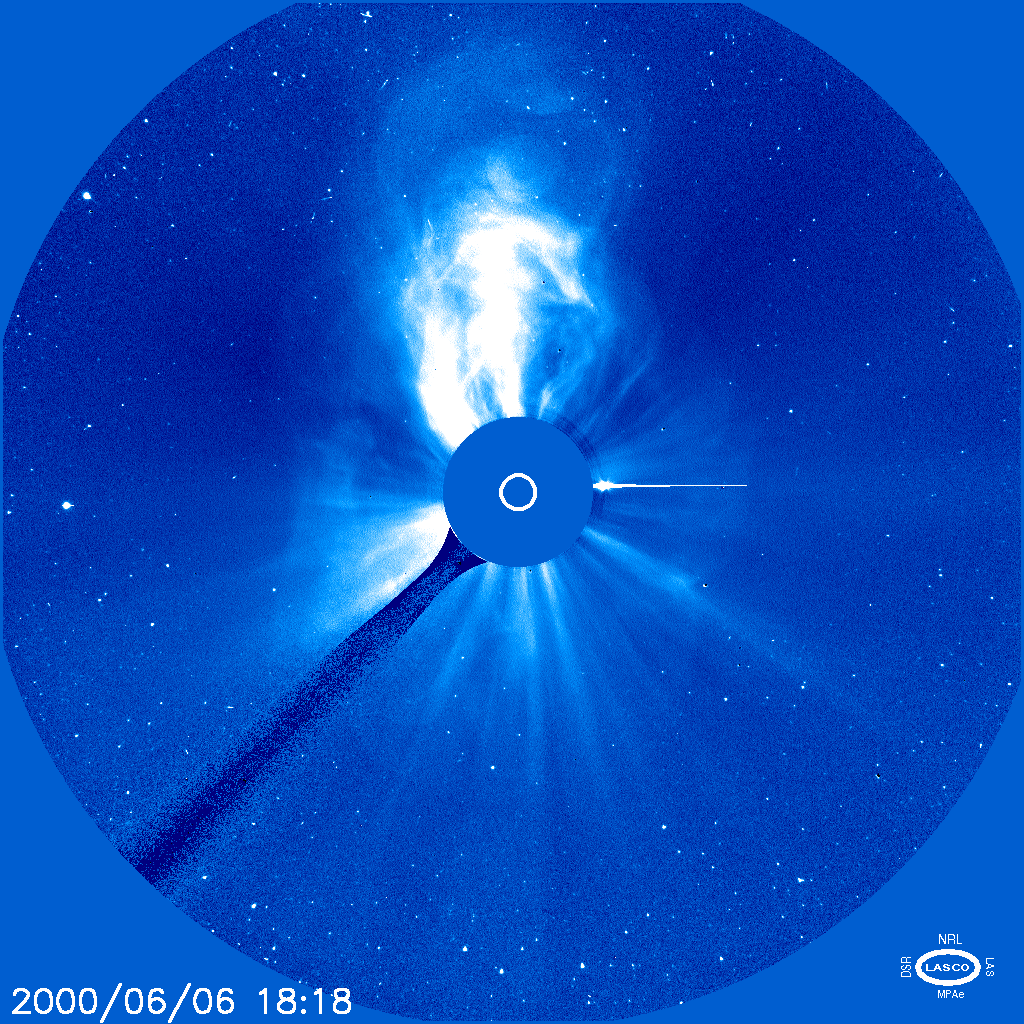
Caption: For the first time during this solar cycle, the Sun put up a spectacular fireworks display with two X-class flares going off in close succession from one and the same active region (AR 9026). The flares were clocked in at about 13:39 UT and 14:25 UT on 6 June, 2000.
But that was not the end of the story! A third X-class flare from the same region peaked at 15:53 UT on 7 June, just one day later.
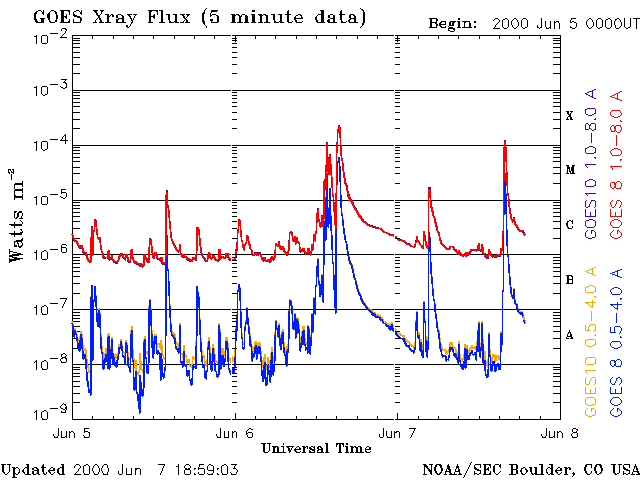
The X-ray activity is detected by the GOES satellite, as shown in the plot below from the National Oceanic and Atmospheric Administration's Space Environment Center (NOAA/SEC):
(Click on image to view enlarged plot)
The first two flares were also associated with a "full halo coronal mass ejection (CME)", which means that a huge cloud of material is ejected in the direction of the Earth. A faint halo CME was reported from the third event, in the LASCO C2 images starting at 16:30UT. The first halo CME washed over the SOHO satellite on 8 June 200 at about 9UT, somewhat earlier than expected. Shortly thereafter, it hit the Earth's magnetosphere, causing a geomagnetic storm. The arrival of the CME at SOHO's position is evident from the sudden jump in the solar wind speed in the plot below, as measured by the CELIAS MTOF Proton Monitor. Click on the image for an annotated plot including the solar wind density, thermal velocity, and angle. The second halo CME produced very small effects.
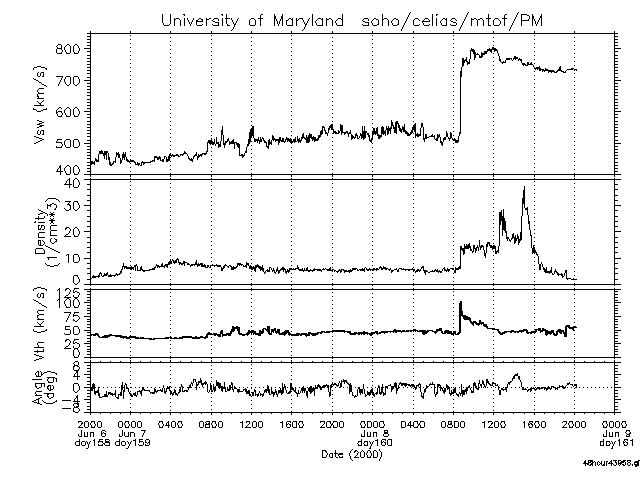
A continuously updated plot of the last 48 hours can be found on the CELIAS MTOF Proton Monitor page
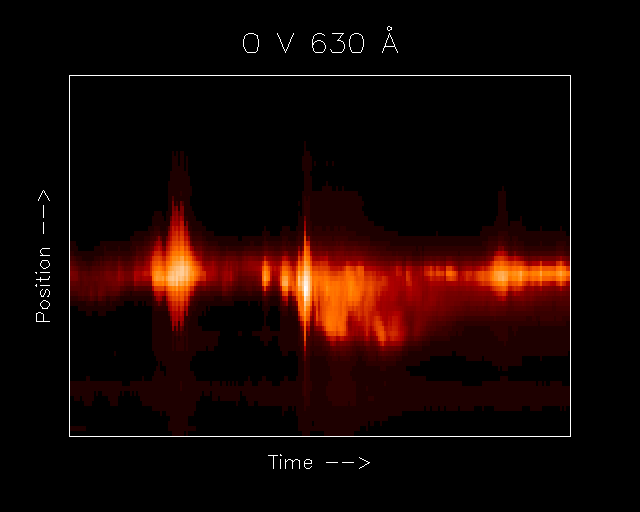
Images of the flaring active region was also captured by chance by a third SOHO instrument, the Coronal Diagnostic Spectrometer (CDS). Although the detectors were heavily saturated, causing detector "bleeding", we include images of the observations below.
|
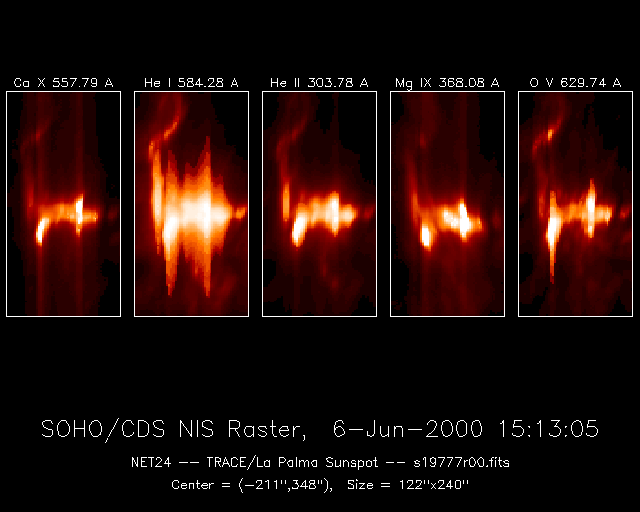 |
| A time series spanning from about 13UT-14UT. Time goes from left to right, and the first flare is close to the middle of the series, indicated by an arrow. Up/down on the image is north/south on the Sun. Solar features drift slowly past the slit position, so some of the apparent time variation is actually spatial in origin. At the end of the time series, the slit is located at the center of the image shown to the right. | A context image in 5 different emission lines, capturing the decaying phase of the second X flare. Since the CDS instrument takes images by scanning its slit from right to left, some of the spatial variations in this direction are actually due to time variations in the intensity. Click on the image for a larger, annotated version. |
Related links:
- NASA Science News
- Event page from International Solar-Terrestrial Physics (ISTP)
- Today's space weather by SEC/NOAA
- Real Time Geo-Magnetic Storm Level Estimate
- Event page from International Solar-Terrestrial Physics (ISTP)
Picture Credit: SOHO/LASCO, SOHO/EIT, and SOHO/CDS (ESA & NASA)
Instrument/observatories: LASCO (Large Angle and Spectrometric
Coronagraph); Extreme ultraviolet Imaging Telescope (EIT);
Coronal
Diagnostic Spectrometer (CDS); Charge, Element and Isotope Analysis
System (CELIAS);
Geostationary Operational Environmental
Satellite (GOES).
Taken: 6 June 2000

