Here we calculate the velocity and acceleration of a coronal mass ejection (or CME) based on its position in a series of images from the LASCO instrument on SOHO.
A coronal mass ejection occurs when a significant amount of relatively cool, dense, ionized gas escapes from the normally closed, confining, low-level magnetic fields of the Sun's atmosphere to streak out into the interplanetary medium, or heliosphere. In other words, a large quantity of mass is accelerated by the magnetic field of the corona and travels through space, sometimes towards the Earth. Eruptions of this sort can produce major disruptions in the near Earth environment, affecting communications, navigation systems and even power grids. SOHO with its uninterrupted view of the Sun, can observe such events continually, and allow us for the first time to get a better understanding of how such violent events occur.
Materials:
If you are doing this on paper you will need
- SOHO CME IMAGES
- ruler
- calculator
|

|
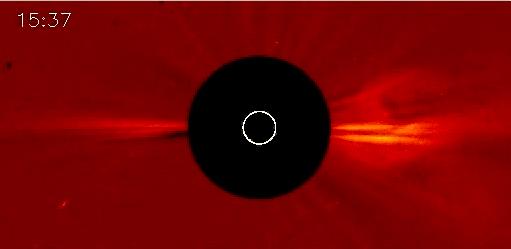
At left is an image taken from one of the coronagraphs on LASCO.
To the right of the disk we can see a CME erupting from the Sun.
|
-
Select a feature that you can see in all five images, for instance
the outermost extent of the bright structure or the inner edge of the
dark loop shape. Measure its position in each image. Measurements on
the screen or page can be converted to kilometers using the simple
ratio:
- dscreen/dactual= sscreen/sactual
where:
- dscreen is the diameter of the Sun measured on the screen.
- dactual is the actual diameter of the Sun.
- sscreen is the position of the mass as measured on the screen.
- sactual is the actual position of the mass.
The diameter of the Sun = 1.4 × 10⁶ (1.4 million) km.
-
Using the position and time, you can calculate the average velocity.
Velocity is defined as the rate of change of position. Using the
change in position and the change in time, the average velocity for
the time period can be calculated using the following equation:
- v = (s2 - s 1)/(t2 - t1)
where:
- s2 is the position at time, t2.
- s1 is the position at time, t1.
The acceleration is the change in time of the velocity:
- a = (v2 - v 1)/(t 2 - t1)
where:
- v2 is the velocity at time, t2.
- v1 is the velocity at time, t1.
-
You can record your results in a table:
Universal Time Time Interval Position Average Velocity Average Acceleration 08:05 _ _ _ _ 08:36 _ _ _ _ 09:27 _ _ _ _ 10:25 _ _ _ _ 11:23 _ _ _ _
(Click for movie)
Further Questions and Activities
Select another feature, trace it, and calculate the velocity and acceleration.
Are they different from those for the last feature you selected?
Which one is "right"? Scientists often look at a number of points
in different parts of the CME to get an overall idea of what is
happening.
Sometimes it can be tough to trace a particular feature.
How much error do you think this introduces into your
calculations?
How does the size of the CME change with time?
What kind of forces do you think might be acting on the CME? How would these account for your data? These are important questions in CME research!
Exploring SOHO data
If you look at the data available from LASCO in the
SOHO Gallery and elsewhere, you will see that the
images usually have a circle in the center of the coronagraph disk
representing the size and position of the Sun. Using this to find the scale
of the image, you can make calculations similar to the one you
just did for most sequences of LASCO images.
LASCO also observes comets. You can measure their velocities and accelerations too.