
Checking on the Sunspot Cycle (December 16, 2003)
Hi-res TIF image (3.1M)
|
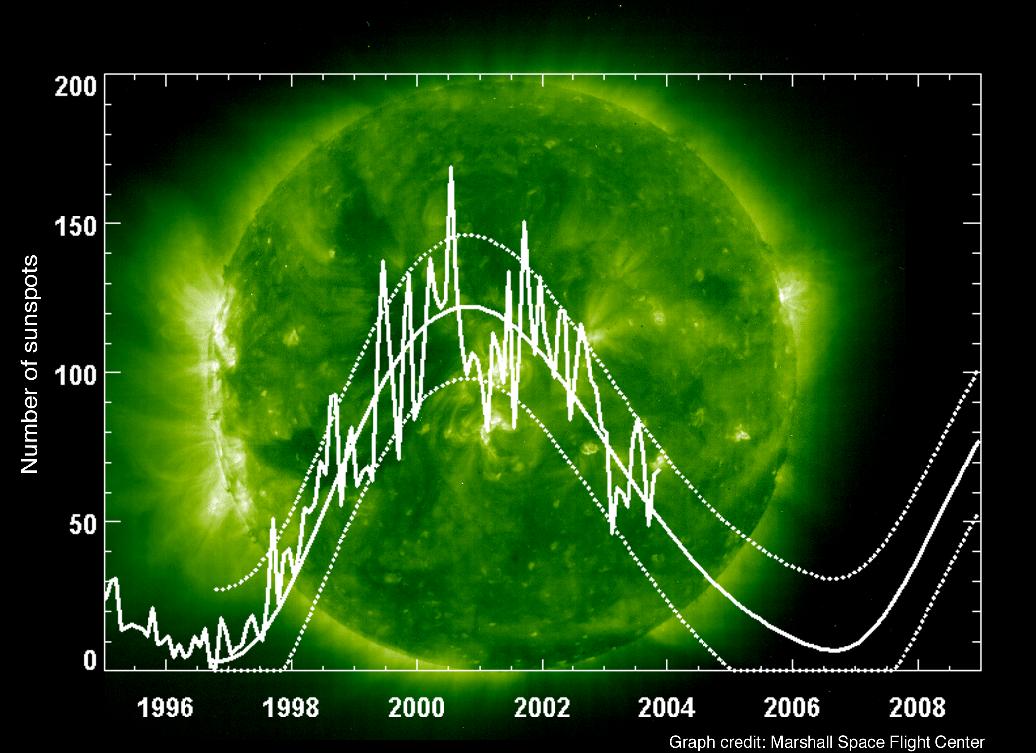
Despite the unexpected surge in solar activity in late October
through early November, in fact the number of sunspots continues to
decline as we move away from the solar maximum period of peak
activity for this 11-year solar cycle. Scientists track solar cycles
by counting sunspots. The current solar cycle reached its peak level
in July 2000. Since then, the number of sunspots and general solar
activity has generally declined, though it did attain a second peak
around January 2002. Inevitably, the number of sunspots will continue
to go down until the numbers bottom out during the period of solar
minimum, sometime around 2006. The chart is seen here projected onto
an extreme ultraviolet image of the Sun taken 16 December 2003 that
reveals only a few areas of solar activity (whiter areas). The jagged and heavier white line represents the monthly sunspot numbers observed. The solid curve is an estimate of the monthly mean sunspot numbers, and the dotted curves represent the limits within which the real sunspot numbers are expected to fall. Please visit our Newsroom for press releases and media coverage.
SOHO began its Weekly Pick some time after sending a weekly image or video clip to the American Museum of Natural History (Rose Center) in New York City. There, the SOHO Weekly Pick is displayed with some annotations on a large plasma display. If your institution would also like to receive the same Weekly Pick from us for display (usually in Photoshop or QuickTime format), please send your inquiry to steele.hill@gsfc.nasa.gov. |