GALLERY
Gallery
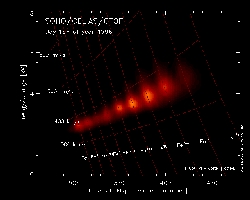
The distribution of iron charges states is shown for DOY 196 of 1996 using CTOF PHA data. On this particular day even Fe16+ can be identified. The E/Q axis is a measure for the velocity of the iron ions. The "horizontal" lines are drawn for ion velocities of 300, 400 500, and 600 km/s from bottom to top, as indicated. The "vertical" lines give the charge state of the iron ion, as indicated. The charge state distribution is a measure of the electron temperature in the corona. If the charge state distribution is centered at high charges, the electron temperature is high and vice versa.
Downloads
- Full-size image [JPG, 119K]
- Medium-size image [JPG, 29K]
- Hi-resolution size image [TIF, 322K]
- Medium-size image [JPG, 29K]


