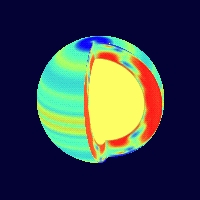
VARIATIONS IN SOLAR MOTION IMAGE: This image is taken using the Michelson Doppler Imager (MDI) instrument on the NASA/ESA Solar and Heliospheric Observatory (SOHO) spacecraft. It is a result of computations using observations taken continuously from May 1996 to May 1997. This false color image represents the difference in speeds between various areas on the Sun, both at the surface and in the interior. Red - yellow is faster than average and blue is slower than average. On the left side of the image, the light orange bands are zones that are moving slightly faster than their surroundings. The new SOHO observations indicate that these extend down approximately 12,000 miles into the sun. Sunspots, caused by disturbances in the solar magnetic field, tend to form at the edge of these bands. Scientists at the Stanford University, Calif. Solar Oscillations Investigation (SOI) group speculate that this may be due to the difference in speed at the edge of these zones that tend to “twist” the magnetic field generated by the moving hot, electrically charged gas called plasma. The cutaway on the right side of the image reveals speed variations in the interior of the Sun. Only the outer 30 percent of the Sun’s interior where the variations are more certain is shown. The red ovals embedded in the green areas at the poles are the newly discovered polar plasma “jet streams”. They move approximately ten percent faster than their surroundings, and each is about 17,000 miles across, large enough to engulf two Earths. (Photo Credit: Stanford University)
Downloads
- Full-size image [JPG, 94K]
- Medium-size image [JPG, 16K]
- Hi-resolution size image [TIF, 351K]
- Medium-size image [JPG, 16K]


