EIT Observations of the Extreme Ultraviolet Sun
by D. Moses, F. Clette , J.-P. Delaboudinière, G. E. Artzner,
J. Brunaud, C. Carabetian, A. H. Gabriel, J. F. Hochedez, F. Millier,
X. Y. Song, B. Au, K. P. Dere, R. A. Howard, R. Kreplin, D. J. Michels,
J. M. Defise, C. Jamar, P. Rochus, J. P. Chauvineau, J. P. Marioge,
R. C. Catura, J. R. Lemen, L. Shing, R. A. Stern, J. B. Gurman,
W. M. Neupert, J. Newmark, B. Thompson, A. Maucherat, F. Portier-Fozzani,
D. Berghmans, P. Cugnon, E. L. Van Dessel, and J. R. Gabryl
- Images
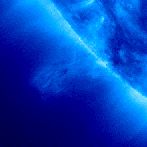
- Fig. 1a:
. EIT image of the Sun in the 171 Å channel, 1997 January 31.
The 5 s exposure began at 01:00 UT. The principal spectral lines in this
bandpass are Fe IX 171.0 Å and Fe X 174.5 Å. The pixel scale is
2.59 arc sec, and there are 1024 x 1024 pixels.
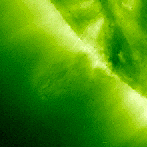
- Fig. 1b:
. EIT image of the Sun in the 195 Å channel, 1997 January 31.
The 9 s exposure began at 01:06 UT. The principal spectral lines in this
bandpass are Fe XII 192.3, 193.5, and 195.1 Å.
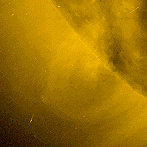
- Fig. 1c:
. EIT image of the Sun in the 284 Å channel, 1997 January 31.
The 25 s exposure began at 02:00 UT. The principal spectral line in this
bandpass is Fe XV 284.1 Å.
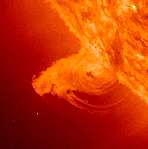
- Fig. 1d:
. EIT image of the Sun in the 304 Å channel, 1997 January 31.
The 62 s exposure began at 02:06 UT. The principal spectral lines in this
bandpass are He II 303.7 Å and Si XI 303.3 Å.
- Movies
- Movie 1. A time series of full-resolution
(2.59 arc sec/pixel) images of the SW limb of the Sun, in Fe XII 195 Å
obtained on 1996 December 23 - 24. The movie frames were excerpted from
full-frame images obtained as part of a special, high telemetry bandwidth
LASCO/EIT campaign.
A small, erupting filament appears at 20:20 UT. At 20:20 UT, a bright loop
structure has appeared, and the filament material (in absorption) is elongated.
Observations of this event in EIT and all three LASCO cameras are described in
Dere et al. (1997, this issue). The CME is followed by a more gradual
eruption of the southern polar crown filament.
- Movie 2. A time series of 320 x 320 pixel (13.8 x 13.8
arc min) images in He II 304 Å, 1996 December 28 16:10 - 18:13 UT, with
a cadence of approximately 1 minute between the start of each 23 s exposure.
The subfield was centered near disk center.
- Movie 3. A time series of 320 x 320 pixel (13.8 x 13.8
arc min) images in Fe XII 195 Å, 1996 December 28 20:53 - 21:59 UT, with
a cadence of approximately 1 minute 7 seconds between the start of each
12 s exposure. The subfield was centered near disk center.
- Movie 4. A time series of full-resolution
(2.59 arc sec/pixel), subfield images of the N polar coronal hole,
in Fe XII 195 Å obtained on 1996 July 13 15:48 - 16:29 UT.
Each frame is 512 x 160 pixels (22.1 x 6.9 arc min) and was exposed for
22 s; the cadence is approximately 70 s.
A microjet appears at the beginning of the sequence (15:48 UT) at the top of
a low-lying loop or set of loops to the W of the pole. The jet extends to the
edge of the field of view, and appears to turn as it does. The microjet has
left the field of view by 16:02 UT. At the end of the sequence (16:19 -
16:29 UT), a dark surge or macrospicule occurs at what had been the location
of the base of the microjet.
- Movie 5. One day of the SOHO-EIT "CME watch" program in
Fe XII 195 Å: half-resolution (5.08 arc sec pixel) images were obtained
roughly every 17 minutes from 00:12 to 23:41 UT on 1997 May 12. NOAA AR 8038,
from which coronal mass ejections (CME's) originated on 1997 May 9 and May 10,
produced another CME, with transient coronal holes (CME cavity) to both the N
and S of the active region. The latter is first visible in the image at
04:50 UT. A Moreton wave propagates symmetrically outward from the region, and
extends to the far limb within 1.5 hour. Postflare loops continue to be
visible to the end of the sequence.
Although a flare of soft X-ray class C1.3, beginning at 04:42 and peaking at
04:55 UT, was associated with this event, it is impossible to say from the
coarse cadence of the EIT observations whether the flare and CME began
simultaneously. It is worth noting, however, that a similar event on 1997
April 7 in AR 8027 produced a weaker Moreton wave (at least as viewed in
Fe XII 195 Å) but was associated with a C6.8 flare.
-
QuickTime version of the movie (~11MB)
-
MPEG version of the movie (~1.0MB)
-
IDL® version of the movie (~18MB) (cf. instructions on viewing. This
sequence may be better viewed by darkening the low end of the color
table [selecting Color Tables... and moving the
Bottom slider control to a value in the range
8 - 24]. On a fast machine, running the movie at as high a frame rate
as possible may convince the viewer of the presence of outflow or
outward wave propagation in all the plumelike features visible at the
pole.
Current EIT images can be viewed at the
EIT full-frame Web page.
More information on the EIT instrument, current observations, analysis
software, and the EIT data rights policy, can be found at the
EIT home
page.