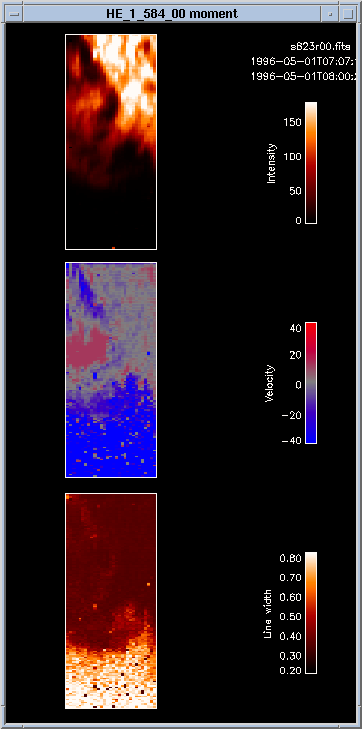
Figure 9a(above)
Fig.9a (~0.03Mb), Fig.9b (~0.03Mb): CDS observations between 07:07 and 07:58 UT for He I (a) and O IV (b) lines. Top panels, intensity; middle panels, Dopplerhift; low panels, line width. The redshifted part corresponds to the SUMER bubble A, the blueshifted one to the SUMER structure B.
Paper |
|
|
|
|
|
|
Contents |
|
|
|
|
|
|
Help |